
![]()
![]()
![]()
Welcome to ReliaGrowR! This package provides modeling and plotting functions for Reliability Growth Analysis (RGA) and Repairable Systems Modeling, including:
Reliability Growth Analysis
Repairable Systems Modeling
AI Integration
rga_mcp_server()RGA is focused on improving reliability during development and testing of products, while repairable systems modeling tracks recurrence patterns for fielded systems that can be repaired and returned to service. By analyzing failure data, both approaches help engineers and researchers identify trends, estimate reliability parameters, and support decision-making over time.
To learn more about RGA, please view the RGA vignette. For repairable systems modeling, see the RSA vignette. For test planning, see the RDT vignette. For AI integration, see the MCP vignette.
To install the release version of ReliaGrowR, use:
install_packages('ReliaGrowR')You can install the development version of ReliaGrowR like so:
devtools::install_github('paulgovan/ReliaGrowR')Here is a basic example of Reliability Growth Analysis. First, load the package.
library(ReliaGrowR)Next, suppose a machine has failed at the following times with the corresponding number of failures.
times <- c(100, 200, 300, 400, 500)
failures <- c(1, 2, 1, 3, 2)
To perform RGA, use the rga function and plot the
results. The plot displays the cumulative failures over time along with
the fitted reliability growth model.
result <- rga(times, failures)
plot(result, main = "Reliability Growth Analysis", xlab = "Cumulative Time", ylab = "Cumulative Failures")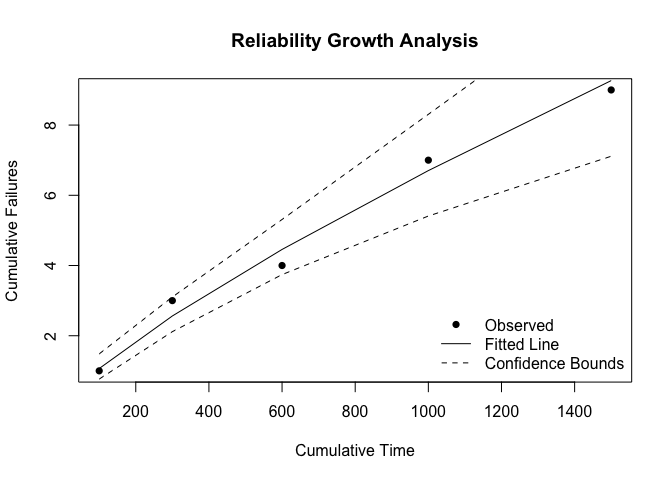
ReliaGrowR can expose its analysis functions as Model Context Protocol (MCP) tools so AI assistants like Claude can call them directly. First install the required packages:
install.packages(c("mcptools", "ellmer"))Then add the server to Claude Code:
claude mcp add -s user reliagrowR -- Rscript -e "ReliaGrowR::rga_mcp_server()"Once configured, you can ask Claude to fit models, run forecasts, plan demonstration tests, and more — all without writing any R code yourself. See the MCP vignette for full setup instructions.
Please note that the ReliaGrowR project is released with a Contributor Code of Conduct. By contributing to this project, you agree to abide by its terms.